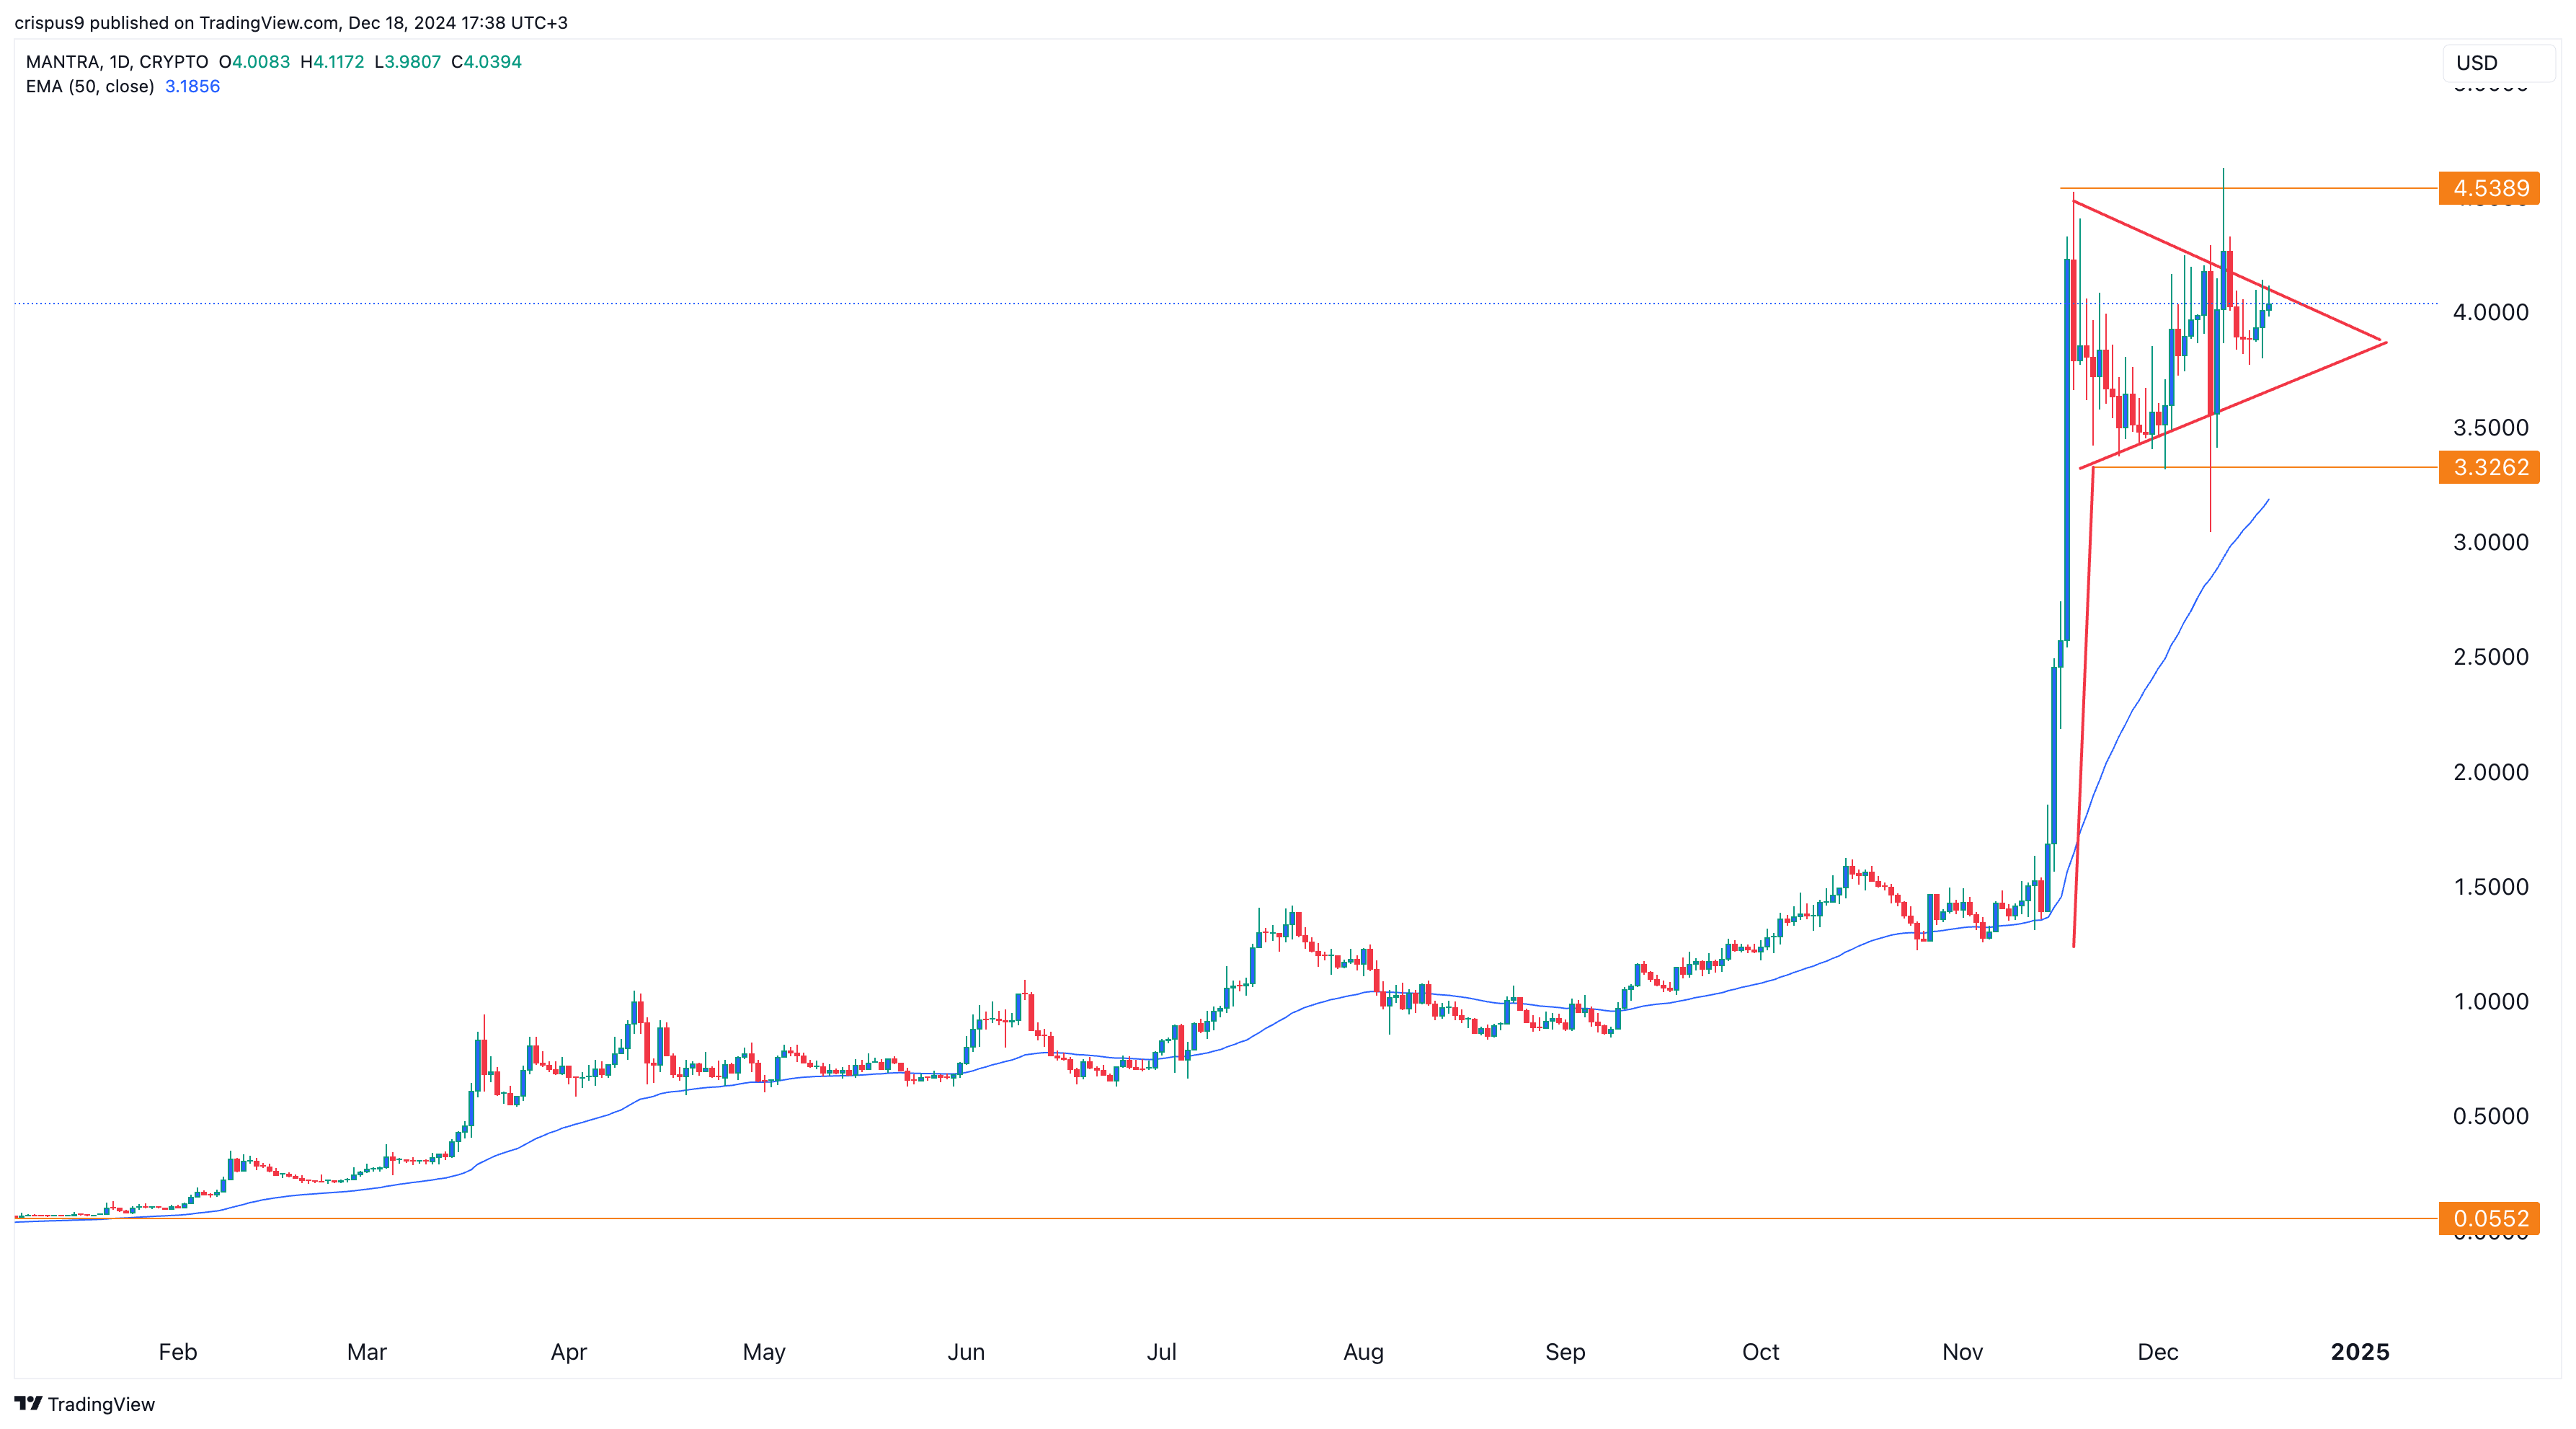
Mantra price rose for three consecutive days, becoming one of the best-performing cryptocurrencies as most others declined.
Mantra (OM) token rose to $4, slightly above the lowest level this week. This rebound pushed the token’s market cap to over $3.8 billion.
Its rally occurred even as the staking yield dropped to 15.4%. This represents a decline of over 12% in the last 24 hours, according to StakingRewards. This drop happened despite the staking market cap rising by over 5% to $2.4 billion.
Still, Mantra offers one of the highest staking rewards in the crypto industry. For instance, Polygon yields 5.6%, while Ethereum (ETH) and Solana (SOL) yield 3.2% and 6%, respectively.
Staking involves delegating tokens to help secure a network. Yields typically come from the fees the network earns and are distributed monthly.
Mantra’s high staking yield has contributed to its status as one of the best-performing cryptocurrencies this year, with its price increasing by over 7,200% from its lowest point.
This rally intensified recently when the network launched MantraChain, a layer-1 network for building Real World Asset tokenization products. MantraChain aims to become the main blockchain for developers in the fast-growing tokenization sector.
According to its developers, the chain addresses the blockchain trilemma of decentralization, security, and scalability by leveraging Cosmos SDK, one of the most popular frameworks in the crypto industry.
The tokenization industry has grown significantly in recent years. For example, Ondo Finance (ONDO), a leading tokenization project, has accumulated over $600 million in assets. Other tokenized assets, such as BlackRock’s BUIDL and Franklin Templeton’s FOBXX, have a combined total of over $1 billion in assets.
Mantra price prepares a big move ahead

The daily chart shows that OM price has been consolidating in recent weeks following its vertical rally in November.
This consolidation phase forms part of a bullish pennant chart pattern, a popular continuation signal. The pattern consists of a long vertical line followed by a symmetrical triangle. Assets typically experience strong breakouts when the triangle approaches its confluence point.
If the pattern holds, OM price could rebound and initially rise to its year-to-date high of $4.5. A move above that level could signal further gains, potentially pushing the price to the next psychological level of $5. However, a drop below the support level at $3.5 would invalidate the bullish outlook.
Source link
 Palmer Legals Reaching Your Expectation


